‘Election Atlas of India’, through photo collages and thematic maps, is a seminal ready reckoner on Lok Sabha elections
‘Election Atlas of India’, through photo collages and thematic maps, is a seminal ready reckoner on Lok Sabha elections
When India goes to the parliamentary polls every five years, more than an eighth of the world’s population queues up over two summer months to elect a Government. For a populace that speaks 22 official languages and thousands of dialects, lives in rich urban suburbs or poor rural hamlets in terrain scattered across teeming cities, deciduous forests, scrub jungle, deserts and mountain villages, and is drawn from a cross-section of castes and creeds, it is perhaps the only exercise that offers a level-playing field.
The Election Commission of India (ECI), the constitutional body that conducts and regulates elections, has since its formation in 1950 faced many logistical challenges. It draws on the lakhs of poll workers and security forces to ensure free and fair elections. And, because no voter is made to travel too far from home to exercise one’s franchise, poll officers shuttle ballot boxes by even helicopter, boat, elephant-back and through knee-deep mountain streams to mark the indelible link on the index finger (a practice since the Third General Election in 1962) to indicate that one has chosen a representative.
This mammoth democratic exercise, the world’s largest, that began in 1952, with the most recent being held in 2019, is keenly watched and contested. Electoral shifts in voting, the cost of elections, and the issues on which they are fought have changed over seven decades. All this data now finds its way into a first-of-its-kind book Election Atlas of India, compiled, researched and published by New Delhi-based Datanet India.
The ‘Election Atlas of India’ has over 500 pages of information and maps
| Photo Credit: Special arrangement
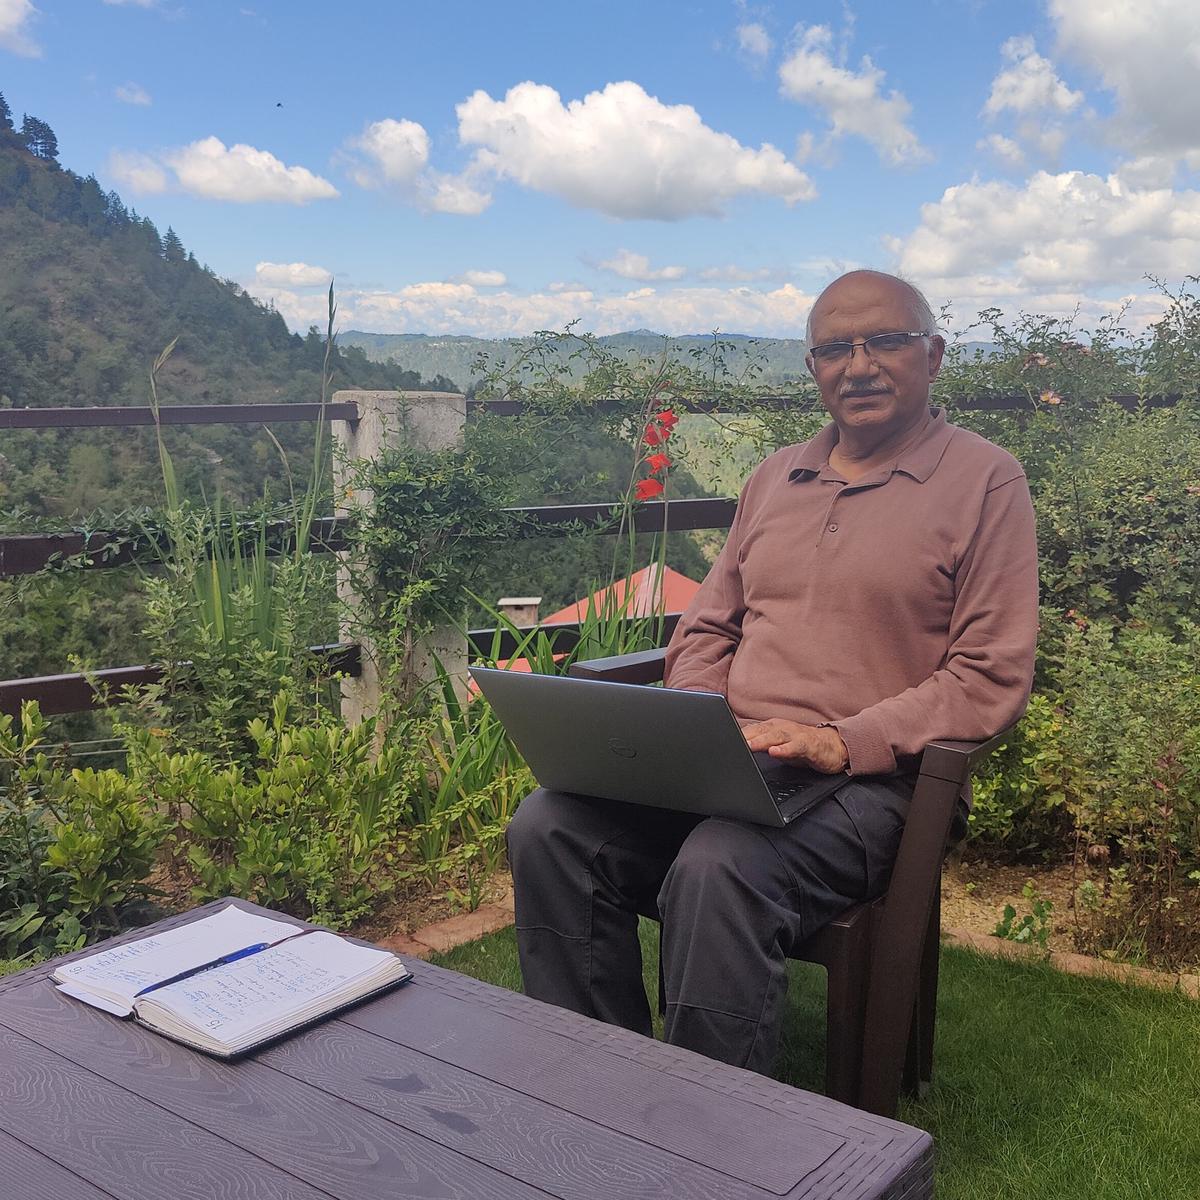
Speaking from his home in Mukteshwar, Uttarakhand, 64-year-old RK Thukral, editor-director, says, “Ever since I completed my Master’s in Economics and PhD on Industrial Economics from Kumaun University, statistical studies on India have fascinated me. I published The Uttar Pradesh Statistical Calendar, drawn from my thesis and other studies based on the State. While working with Dainik Jagran from 1995 to 2000, I started the Jagran Research Centre in partnership with them. In the course of my work I met Madan Bahal [MD of Mumbai-based Adfactors PR], and in 2000 we started Datanet and launched the Indiastat project in November. But it was only in 2004 that the project gained recognition when the World Bank reached out seeking data.”

RK Thukral, editor of the book and director, Datanet working remotely at Mukteshwar, Uttarakhand
| Photo Credit: Special arrangement
Since then, Datanet has been the go-to space for renowned universities such as Harvard and business schools such as the IIMs seeking data on the subcontinent. From ebooks, web access and physical books on districts of India and Vidhan Sabha constituencies, a statistical study on India’s elections seemed a natural progression and work began on the book in 2014. “It was a mammoth task as some constituencies were added, others bifurcated, some deleted,” says Thukral, adding “that 148 assemblies have had their names changed. Most of the data is with the ECI, but mapping requires constant updation. We have our own geographical information system where our coloured maps are generated. We also draw from the resources of the Census Commission, Delimitation Commission and Photo Division of the I&B Ministry. All this has perhaps made the book a unique compilation.”

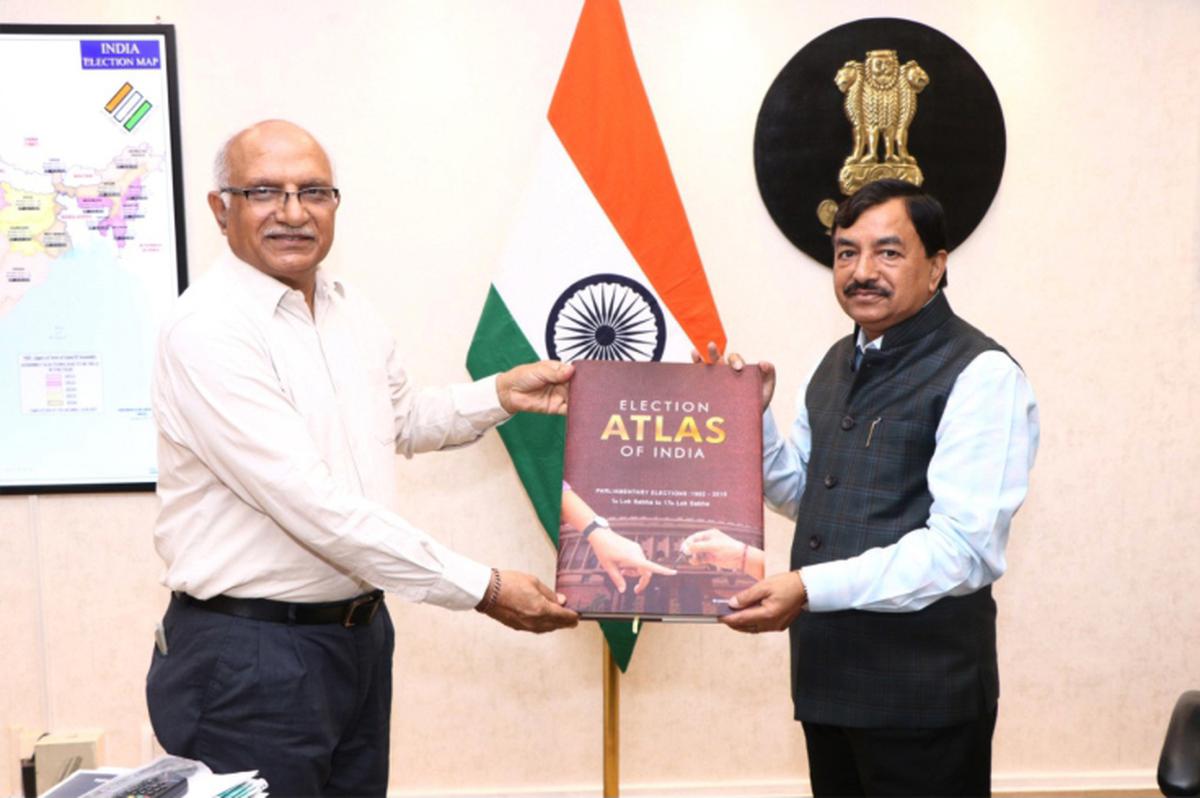
RK Thukral with the former Chief Election Commissioner of India, Sushil Chandra
| Photo Credit: Special arrangement
At nearly 500 A3-size pages and weighing a couple of kilograms, the Election Atlas of India is the kind of tome that would strike a chord with psephologists, academics, researchers, students and anyone interested in how India has voted over the years. Updated till January 2022, the book follows the chronology of parliamentary elections, looking beyond winners, key candidates and winning margins. The introduction to each election also lists interesting trivia: Shyam Saran Negi, a school teacher in Kinnaur cast the first vote in independent India’s first election in 1951. The tehsil in Himachal Pradesh went to vote five months earlier than the rest of the country because of inclement weather.
“Our research team numbers around 60 and has been working remotely since the pandemic. The lead researcher is Shafeeq Rahman and our researchers come from a variety of academic backgrounds such as statistics and library sciences.”
The introductory page to every election is chock-a-block with black and white photographs from across India — snaking queues, voters being borne to centres in baskets carried on shoulders, campaigning on horseback, AB Vajpayee winning crowds with his poems, Rajiv Gandhi looking forlornly into the distance — each one a record of our incredible journey as a nation.


